About this station
SS.OAKM1.00.EHZ · Oakmont, Santa Rosa, CA
The station
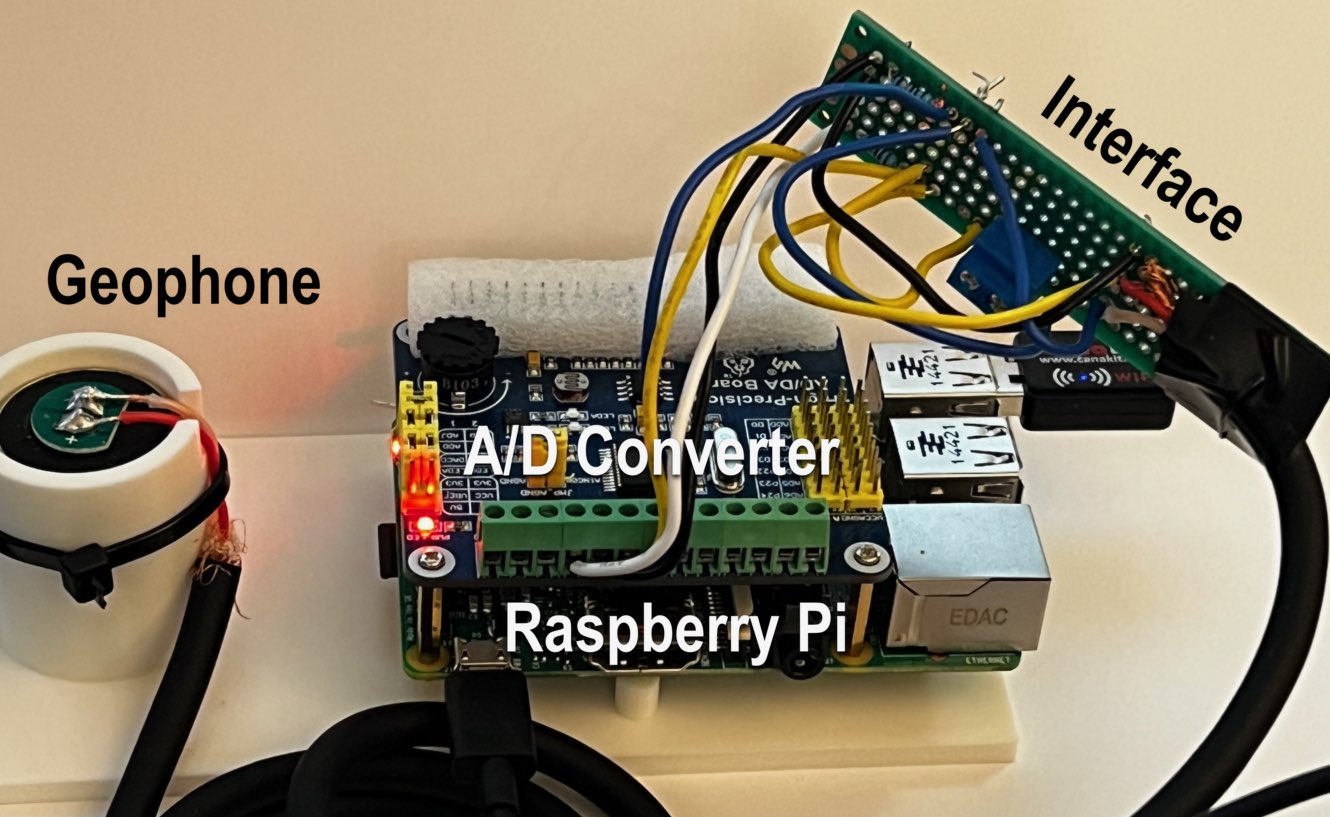
The station during bring-up, July 2026 — geophone, ADS1256 digitizer and Raspberry Pi, before the printed enclosures. It now lives in two cases on the garage floor.
What this is
A homemade (“DIY”) seismometer — an amateur instrument that senses the ground moving: earthquakes, the ocean, and everyday cultural vibration. It records continuously and is independent (not part of a formal seismic network), built for curiosity and learning. Not for scientific or emergency use. The station is still being tested, tuned, and modified, so spurious signals (from the work itself, not the ground) may appear in the data.
It does have a proper name. Seismic stations are identified by a four-part code — network, station, location, channel — and this one is SS.OAKM1.00.EHZ. OAKM1 was entered in the International Registry of Seismograph Stations on 24 September 2026, which is a directory entry rather than membership of a network: it means the name is unique worldwide and points at this garage. The SS prefix is the code the standards bodies set aside for anyone running a single station of their own — it is shared with every other such station, so it is a legitimate name and not an assigned one. The EHZ says short-period, high sample rate, vertical.
New to any of this? Seismology 101 explains P and S waves, microseisms, what this sensor can and cannot hear, and every term used on these pages.
Hardware
- Sensor: LGT-4.5 geophone — a 4.5 Hz vertical geophone (a coil-and-magnet velocity sensor), ~28.8 V per m/s, 385 Ω coil.
- Digitizer: Waveshare High-Precision ADS1256 — 24-bit ADC, read differentially at gain 64, 100 samples/sec.
- Computers: a Raspberry Pi 2B does acquisition (owns the ADC, through a small C reader); a Raspberry Pi 5 on the home network keeps the archive and builds these charts and pushes them, outbound only, to this public copy on a cloud host every minute — nothing at the house is reachable from the internet.
- Front end: differential bias network into the ADC (shunt damping to come).
How to read the charts
Live waveform — the ground moving right now, in microvolts of sensor output (proportional to ground velocity). Flat = quiet; wiggles = motion. It auto-scales, so a calm trace and a busy one can look similar in height — watch the “pp” number.
Helicorder (drum plot) — the classic seismograph view. Each row is 15 minutes; read it like a book — left → right, then down to the next row. The last 4 hours (UTC). Earthquakes and bumps appear as bursts standing out from the steady background hum.
Spectrum (Welch ASD) — the ground’s frequency content: how much signal sits at each frequency. “ASD” is amplitude spectral density (µV per √Hz); “Welch” is the averaging method that turns a jittery signal into a smooth, trustworthy curve. Shaded/annotated zones: the ocean microseism (~0.1–0.35 Hz, the ever-present hum of Pacific swell), the local-earthquake band (~1–15 Hz), the geophone’s 4.5 Hz corner (it’s flat/sensitive above this, and goes progressively deaf below it), and the flat electronic noise floor at high frequency. The plot stops at 0.05 Hz on the left: below the microseism, a 4.5 Hz geophone is ~60 dB down, so anything lower is the instrument’s own noise, not the ground. Seeing below that (distant “teleseismic” quakes, Earth’s slow hum) takes a different sensor — a force-balance broadband, or a DIY long-period pendulum.
Detections — automatic STA/LTA triggers (sudden energy jumps). Most are cultural (footsteps, machinery, doors), not earthquakes — a genuine local quake would show a sharp P arrival followed seconds later by a larger S. The character column describes the shape of each detection, nothing more: “impulsive” means a single sharp spike in an otherwise quiet window, which is what household thumps look like; “sustained” means the energy lasts, and “near-threshold” means it barely cleared the trigger. It is deliberately not an earthquake/not-earthquake verdict — a very close quake is impulsive too, and this station has yet to record a confirmed one to check the labels against.
Where it sits
Oakmont, Santa Rosa, CA — on valley-margin alluvium at the foot of the Sonoma/Mayacamas volcanics, essentially atop the active Rodgers Creek fault system. A sensitive spot for local events, at the cost of a bit more everyday noise.
Privacy — what this site records
Ordinary web-server logs, and nothing beyond them: the page requested, the time, the requesting IP address, the browser’s user-agent string, and the page you arrived from. That is what any web server writes down by default. There are no advertising trackers, and no cookies used to follow you between sites.
The public copy also runs Cloudflare Web Analytics, which is cookieless and does not fingerprint visitors or follow them across sites; and the site sits behind Cloudflare, so their handling of traffic applies as well.
What it is all for: counting visits and seeing which pages people actually read, which is how this station works out what is worth writing next. Aggregate figures from those logs may appear in write-ups or talks about the project — for instance, whether visitors spend longer listening to the live audio than reading the plots. Only totals and averages are ever reported. No individual visitor is identified, and the logs themselves are not published or shared.
Questions are welcome through the project’s public repository.