Seismology 101
what this instrument hears, and the words for it
No background assumed. If a term on the other pages looks like jargon, it is in the glossary at the bottom.
Start here: what this thing actually measures
A seismometer does not measure earthquakes — it measures ground motion, continuously, whether or not anything interesting is happening. Earthquakes are just one of the things that move it.
This instrument measures one specific thing: how fast the ground moves up and down. “Up and down” because it is a single vertical sensor (others add the two horizontal directions), and “how fast” — velocity — because of how it works. Instruments built differently report the ground’s displacement or its acceleration instead; see the glossary.
Inside the sensor (a geophone) is a heavy magnet hanging on a spring inside a coil of wire. When the ground jolts, the case moves but the magnet’s inertia makes it lag behind — and a magnet moving inside a coil generates a voltage. That voltage is the measurement. It is tiny: the quietest signals here are under a millionth of a volt, which is why so much of this project is about fighting electrical noise.
The speeds involved are small too. A quiet night here is ground motion of roughly 35 nanometres per second — about the width of a virus, per second. A person walking past is thousands of times bigger than that.
Putting real numbers on it
The voltage the sensor produces converts straight to a ground speed, because this geophone gives 28.8 volts for every metre-per-second of motion. Working that down to the sizes we actually see:
| At the sensor | Ground speed |
|---|---|
| 1 microvolt (µV) | 34.7 nm/s at the sensor’s nominal rating |
| … but measured against a reference station | ~111 nm/s — see below |
| 1 nanometre/second | 0.029 µV, or about 3 of the digitizer’s steps |
| Smallest step the digitizer can resolve | 0.32 nm/s |
| Quiet-night noise floor (~1.1 µV, 10–15 Hz) | ~37 nm/s |
| Deep-night floor, 1–15 Hz | ~0.8 µV |
How far does the ground actually travel? That is a different question from how fast, and the answer depends on frequency — a fast wiggle covers less distance than a slow one at the same speed (distance = speed ÷ 2π × frequency). At the quiet-night floor, the ground is physically moving by about:
| Frequency | How far it moves |
|---|---|
| 4.5 Hz | ~0.8 nm |
| 10 Hz | ~0.4 nm |
| 20 Hz | ~0.2 nm |
Those distances are smaller than a single atom is wide (an atom is about 0.1–0.5 nm). Detecting motion that small on thirty dollars of hardware sitting on a garage floor is the part worth being slightly amazed by.
How quiet it gets depends enormously on the hour. At 2 AM the noise across the quake band (1–15 Hz) falls to about 0.8 µV, roughly four times quieter than the same measurement at nine in the morning. Almost all of that difference is people: traffic, appliances, footsteps.
How do we know any of these numbers are right? There is a USGS strong-motion accelerometer — station NP.1835, at a Santa Rosa fire house — 1.64 km from this one, and its recordings are public. Comparing the two instruments on the same earthquakes, in a band where this sensor’s response is flat, says this station reads about 3.2× low: its real sensitivity is nearer 9 V/(m/s) than the 28.8 on the datasheet. 46 events agree to within a median 1.22×, and the residual is the same at every frequency from 5 to 15 Hz, which points at the sensitivity number rather than the ground. That correction is provisional — the two sites are 1.64 km apart and ground can respond differently over that distance — and it does not yet say whether the sensor or the amplifier is responsible.
The same comparison answers a fair question: what can this see that a professional instrument cannot? More than you would guess. On quiet nights, between 4 and 8 Hz — the band where the S waves of small local earthquakes carry most of their energy — this geophone’s noise floor is about half the accelerometer’s, and from 8 to 15 Hz the two are at parity. From 2 to 4 Hz the raw numbers favour the geophone by more still, but that band is below its 4.5 Hz corner, where this station’s response has not yet been measured; corrected with the nominal corner and damping it comes out near parity, and the honest word until the calibration is done is unknown. That is physics, not cleverness: a strong-motion accelerometer is built to record two g without clipping, and when its output is converted to velocity its own noise grows toward the low frequencies, while a geophone measures velocity directly and is quietest just above its corner. The accelerometer wins decisively where it was designed to: it never clips, whereas this station saturates at roughly 4 mm/s, a felt earthquake nearby, and it is flat to DC, where a 4.5 Hz geophone is simply deaf. It also costs about a hundred times as much installed. What a home station offers, then, is a sensor that is as good or better in the band that matters for local events, at a price that makes one per garage a reasonable idea, plus a continuous record of one specific place, owned by the person standing on it.
An honest caveat on all of this: the last careful measurement of the instrument’s own noise — taken with the sensor disconnected — put it at 1.18 µV, and the station now routinely reads below that on a quiet night. So the electronics have improved since that measurement and nobody has re-measured them yet. Until that is redone, we genuinely do not know how much of the remaining noise is the ground and how much is the amplifier.
One catch, and it is why the spectrum is cut off at the left: the “34.7 nm/s per µV” figure only holds above about 4.5 Hz. Below that the sensor goes progressively deaf, so the same voltage means much more real ground motion — roughly 5× more at 2 Hz, 20× at 1 Hz. It is a velocity meter with an honest range, not a universal ruler.
P waves, S waves, and how one station can guess the distance
An earthquake sends out several kinds of wave, and they travel at different speeds. That difference is the single most useful fact in seismology.
| Wave | Speed | Motion | What you see |
|---|---|---|---|
| P (primary) | ~6 km/s | push–pull, like sound | arrives first, usually smaller — a sharp tick |
| S (secondary) | ~3.5 km/s | side-to-side shear | arrives later, usually bigger — the real shaking |
| Surface | ~3 km/s | rolling, like ocean swell | slowest, longest-lasting; dominates distant quakes |
Because P outruns S, the gap between them grows with distance — and a single station can therefore estimate how far away a quake was, even though it cannot tell which direction it came from. The rule of thumb: multiply the P–S gap in seconds by about 8 to get kilometres. A 3-second gap means roughly 25 km away; a 10-second gap, about 80 km.
If that feels familiar, it is exactly the same trick as counting the seconds between the lightning flash and the thunder and dividing by five for miles. One event, two signals, different speeds: the gap between their arrivals grows in proportion to distance, at a rate set only by the difference between the two speeds. For thunder the gap grows by five seconds for every mile; for P and S waves it grows by only a fifth of a second per mile — a second of gap means roughly seven kilometres, using the wave speeds measured at this station — because seismic waves are so much faster than sound. Same law, different numbers.
This is also the honest way to tell a real earthquake from someone closing a door: a quake shows two arrivals a few seconds apart, then a long tail that fades slowly (the coda). A door is one thump that stops.
Microseisms: the ocean, humming, forever
Even with no earthquakes anywhere and nobody moving, the ground is never still. Ocean waves press rhythmically on the seafloor, and that pressure radiates through the crust as a continuous, worldwide vibration called the microseism. It is the loudest thing in most seismic records — a permanent background hum, strongest in winter storm season.
It is slow: peaks around 0.07 Hz and 0.15 Hz, meaning one cycle every 7 to 14 seconds. You could not feel it, but a good instrument sees it constantly.
This station cannot hear it, and that is by design rather than by fault — see the next section for why. If you wonder why the spectrum page is cut off at the left, that is the reason.
There are peaks down in that range on our spectrum, but they are not the ocean, and the shape gives it away. A microseism is a broad hump spreading across 0.05–0.2 Hz. What we actually have is a set of narrow spikes at 0.035, 0.07, 0.14 and 0.195 Hz — a fundamental with a period of 28.6 seconds plus its harmonics, which is the fingerprint of a machine cycling on and off somewhere in the house, not of an ocean. (Confirmed by measurement, 2026-07-23. It is a nice coincidence trap: the 0.07 Hz harmonic lands squarely in the microseism band.) Underneath them the curve rises smoothly toward the left, and that part is the instrument’s own electrical noise.
The spectrum page does shade the microseism band, but only to show you where it lives relative to what this sensor can reach — it is labelled “below our response” for that reason.
What this geophone can and cannot hear
Every sensor has a band of frequencies it responds to. This one is a 4.5 Hz geophone: it hears things that vibrate a few times per second and faster, and it goes progressively deaf below that. By the microseism it is around 60 dB down — a factor of a thousand — so those slow ocean waves are simply below the instrument, not missing from the world.
| Source | Frequency | Heard here? |
|---|---|---|
| Footsteps, doors, appliances, cars | 2–30 Hz | Loud and clear — most of what we record |
| Small local earthquake, tens of km | 2–20 Hz | Yes — the target |
| Moderate quake, a few hundred km | 1–10 Hz | Usually, if big enough |
| Great quake on the far side of the planet | 0.01–0.05 Hz | No — arrives as slow swells we are deaf to |
| Ocean microseism | 0.07–0.15 Hz | No — ~1000× below our response |
| Earth’s “hum” (free oscillations) | 0.002–0.007 Hz | No — needs a million-dollar gravimeter |
So this is a local earthquake instrument. The trade is deliberate: a sensor that hears the whole planet costs thousands and needs a vault, while this one costs about thirty dollars and sits on a garage floor above an active fault system.
Why most “detections” are not earthquakes
The station watches for sudden jumps in energy (see STA/LTA in the glossary) and logs each one. Nearly all of them are cultural noise — the seismologist’s word for humans and machinery. Footsteps, a door, the fridge compressor, a car in the driveway.
Frustratingly, you cannot filter them out by size: a sharp thump right next to the sensor produces a bigger reading than a genuine earthquake fifty kilometres away. So the table shows a character label describing the shape of each detection, which is a better clue than its amplitude. It is a description, not a verdict.
If you want to check something yourself, the USGS map lists real quakes with times in UTC. A detection here that matches a catalogue entry, at a sensible P–S gap, is the real thing.
Reading the views on the front page
Live waveform — the last 30 seconds, scrolling. Flat means quiet. The numbers underneath give the current noise level; the smaller the better.
Live spectrum — the same 30 seconds, but broken out by frequency instead of time: which vibrations are present rather than when. The rise at the left is the instrument going deaf, not real ground motion.
Helicorder — the classic paper-drum view, one row per 15 minutes, four hours per screen. This is where an earthquake looks like an earthquake: a sudden fat burst that tapers off, unlike the even fuzz of ordinary noise. Fat rows during the day and thin rows at 4 AM are people, not geology. Small coloured carets mark where quakes in the USGS catalogue should have arrived, so you can check the record yourself — a prediction of where to look, not a claim that this station caught anything. Catalogue entries appear minutes to hours after the event, so the newest rows are always unmarked. The drum has its own section below — how to read the helicorder — including what the colours do and do not mean.
How to read the helicorder
The drum — the helicorder — is the oldest display in seismology and the least self-explanatory. It imitates a machine that really existed: a paper drum turning under an inked pen, the pen tracing the ground’s motion, the drum shifting down one line each rotation so a day of shaking fitted on one sheet. Everything odd about the layout follows from that.
Each row is 15 minutes, and there are 16 of them, so one screen is four hours. The oldest row is at the top and time runs left to right along each row, then down to the next — exactly like lines of text. The numbers along the bottom are minutes into a row, not clock time; the clock time of each row is the label on its left. Everything is UTC, which in California is 7 hours ahead of local time — so a row labelled 09:00 is two in the morning here.
The four colours mean nothing at all. This is the question everyone asks first, and the honest answer is that red, green, blue and black simply repeat every fourth row so your eye can follow one line without sliding into its neighbour. There is one sensor here, measuring one thing — vertical ground velocity. They are not four instruments, four stations, or four frequency bands. On a busy row the trace is tall enough to overlap the rows above and below, and without alternating colours it becomes impossible to tell whose wiggle is whose.
Height is how hard the ground moved. A quiet line is a thin fuzzy band; a loud one swells into a fat spindle. The scale is set by each window’s own typical noise, so a quiet night is not drawn smaller than a busy afternoon — compare shapes, not heights, between windows. Anything enormous is clipped to three rows tall rather than being allowed to scribble over half the screen.
What an earthquake looks like: a sudden onset, a fat burst, then a tapering tail lasting tens of seconds — loud, then gradually not. What ordinary noise looks like: even fuzz, roughly the same thickness all the way across. What a door slam looks like: a single narrow spike with nothing before or after it. Fat rows through the working day and thin rows at 4 AM are people, not geology.
Faded stretches: near or far
A loud burst is genuinely ambiguous on a drum — somebody wheeling a bin past the garage and a real earthquake can look identical. So the station separates them by pitch rather than by size, and it can, because of a fact about how the ground carries vibration: distance filters out the high frequencies. Rock is not a perfect transmitter; the fast wiggles die out within a few kilometres while the slow ones travel on. A real earthquake, even a close one, arrives with almost all its energy below 15 Hz. Something happening three metres away arrives with its high frequencies intact.
Measured here, that difference is stark. An M4.1 earthquake 88 km away put 30 times more energy below 8 Hz than above 15. Rolling a wheelie bin past the sensor did the exact opposite, by a factor of eight. Nothing in between was ambiguous.
So any stretch of the trace that is both loud and high-pitched is drawn faded: that is the station saying this one came from nearby — a footstep, a door, a car in the driveway. Inside a faded burst you will see a solid full-colour core. That is the same moment redrawn using only the 1–8 Hz part of the signal — the band an earthquake would live in. It lets you see through the local racket: if the core stays thin, everything that happened was near-field noise; if the core swells, something arrived in the seismic band and is worth a closer look.
Two honest limits. Fading is a positive identification, not an exhaustive one — only unambiguously high-frequency bursts get marked, so a quieter or lower-pitched local source stays at full strength. Reading “not faded” as “earthquake” is exactly the mistake to avoid. And the core is not the earthquake: it is whatever motion existed in that band, noise included. It narrows the question; it does not answer it.
Does the fading hide anything? No — nothing is removed, and the full recording is kept. It costs sensitivity, not data: measured against a real earthquake replayed into a recorded burst of local noise, an event hiding inside one is about 0.8 magnitude units harder to see than the same event on a quiet night. During a noisy stretch this is a less sensitive station, not a deaf one.
The triangles
Small coloured carets mark where an earthquake from the USGS catalogue should have arrived, given its distance and the speed of seismic waves through this crust. The label is its magnitude, and the colour is how likely this station was to feel it at all — strong, likely, or marginal. They are a prompt to look at a particular second, not a claim that anything was detected: the eye decides. Catalogue entries are published minutes to hours after the fact, so the newest rows are always unmarked.
What a real one looks like. The M4.2 Cloverdale earthquake of 29 July, 45 km away, on this drum:
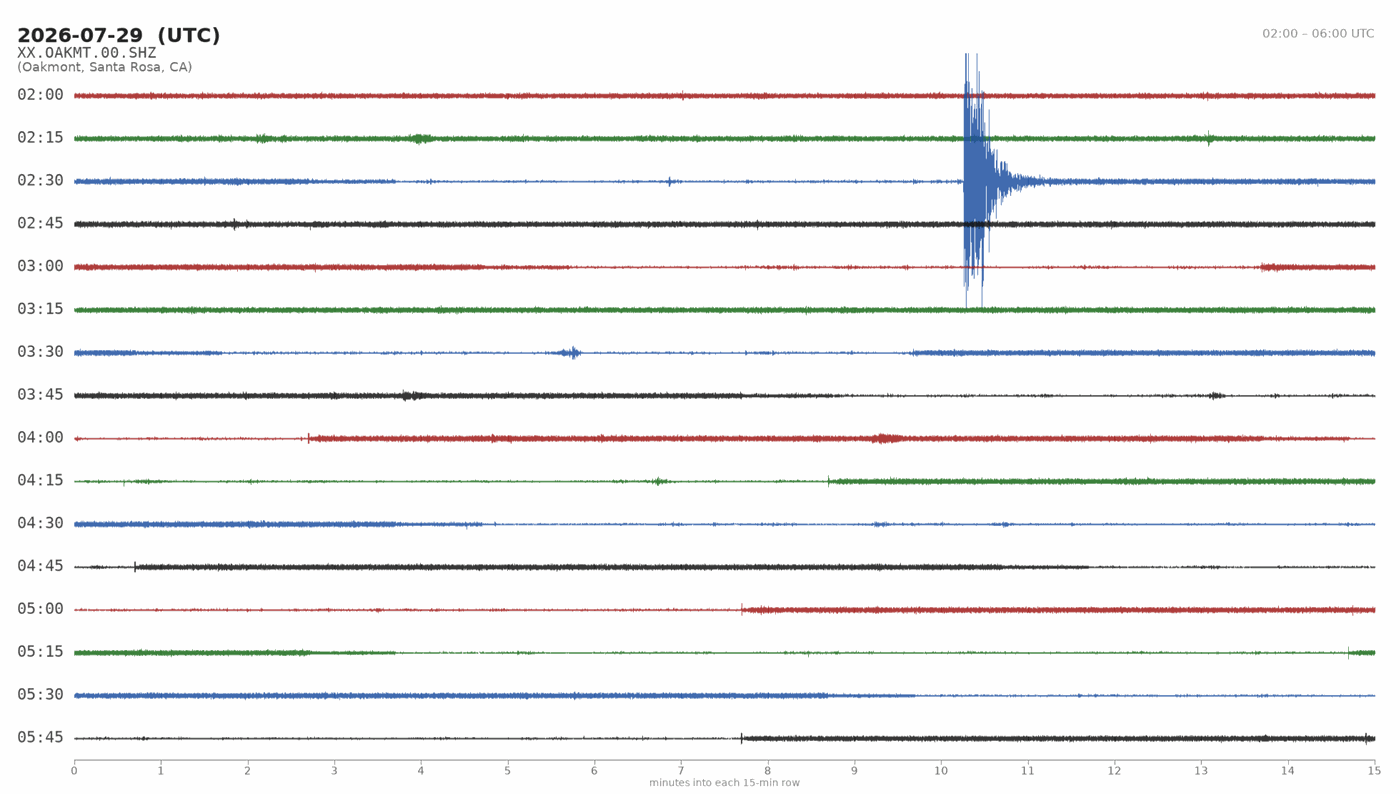
Nothing like the little bursts. At 02:40 UTC the trace swings three rows up and three down — the drum clips there on purpose, so a big event reads as a big event without wrecking its neighbours — and takes about 80 seconds to die away, tapering the whole time. Everything else in those four hours is the ordinary fuzz of a summer night. People in Santa Rosa felt this one as a single jolt. The small blip on the 03:45 row, about 3½ minutes in, is a M2.2 aftershock from the same spot: what a quake nobody feels looks like, a burst that still starts sharp and tapers, a hundred times smaller.
Glossary
| Geophone | The sensor: magnet on a spring inside a coil. Converts ground velocity into a voltage. |
| 4.5 Hz | This geophone’s corner frequency — roughly where it stops responding well as frequencies fall. |
| Hz (hertz) | Cycles per second. 10 Hz = ten vibrations per second. |
| µV (microvolt) | A millionth of a volt. Our quiet-night signal is under one. |
| nm/s | Nanometres per second — actual ground speed. A quiet night here is ~35. |
| Velocity / displacement / acceleration | Three ways to describe the same motion. A geophone (this station) senses velocity — how fast the ground moves. Broadband seismometers report displacement (how far) and accelerometers report acceleration (how hard the shove); each suits a different job. |
| Component | The direction a sensor listens along — vertical (Z, like ours), or the two horizontals (N and E). A full station runs all three. |
| ADC / counts | The analogue-to-digital converter turns the voltage into whole numbers (“counts”) 100 times a second. |
| sps | Samples per second. This station records 100. |
| P wave / S wave | The fast push–pull arrival and the slower, larger shear arrival. Their gap gives distance. |
| Coda | The long fading tail after a quake, from waves scattering off underground structure. |
| Microseism | Continuous worldwide background hum driven by ocean waves, 0.07–0.15 Hz. Below this instrument. |
| Cultural noise | Vibration from people and machines. Dominates any suburban station. |
| Teleseism | A distant earthquake, thousands of km away. Needs a broadband sensor, not this one. |
| STA/LTA | Short-Term Average over Long-Term Average: compares recent energy to the recent past. A big ratio means “something just started” and trips a detection. |
| Helicorder | Drum-style plot, one row per time interval — named for the rotating paper drums of mechanical seismographs. |
| Spectrum / ASD | Amplitude spectral density: signal strength per frequency, in µV per root-hertz. Lets you compare noise at one frequency against another. |
| High-pass filter | Throws away slow drift and keeps the fast wiggles, so slow temperature-driven tilt does not swamp the quake band. |
| Magnitude | Earthquake size on a logarithmic scale: each whole number is ~32× more energy. M2 is barely felt; M6 damages buildings. |
| UTC | Universal time, used for everything here so records worldwide line up. Local time is UTC − 7 in summer. |
| miniSEED | The standard file format for seismic data, so this station’s recordings work with professional tools. |
| Noise floor | The smallest motion the instrument can distinguish from its own electrical hiss. Lowering it is most of the work. |
Where this station sits, and why here
Oakmont, Santa Rosa, CA — on valley-margin sediments essentially on top of the active Rodgers Creek fault system, with the Maacama fault nearby and The Geysers geothermal field about 30 km north. The Geysers is the most seismically active spot in Northern California, producing hundreds of small quakes a year, which makes it the most likely source of anything genuine this station records.
Sitting on soft sediment is a mixed blessing: it amplifies shaking, which helps a sensitive instrument, but it also carries more everyday noise. For a station whose goal is catching small local events, that is the right side of the trade.
Keep learning
A few public-facing explainers worth your time, in roughly the order you might want them. All free, none of them ours.
The home fault first. The Rodgers Creek fault runs under Santa Rosa a few kilometres from this station, and it is the one the professionals name most often when asked where the Bay Area’s next big one comes from:
- Rodgers Creek Fault traced through Santa Rosa (USGS, 2016) — how lidar and magnetic surveys found the fault’s trace under the city, where a century of building had hidden it.
- A new map of the Rodgers Creek fault (USGS) — the current map of the active traces, which turn out to reach 17 km further north than anyone had drawn them.
- The Hayward–Rodgers Creek connection (USGS) — the 2016 finding that the two faults join under San Pablo Bay, so they can rupture together: a 190 km fault, not two shorter ones. That is why the 33 % figure for an M6.7+ by 2043 is quoted for the pair.
Then the general reading:
- The Science of Earthquakes (USGS) — the one-page version of what a fault is, what slips, and why it shakes. Start here if the glossary above was new.
- Magnitude, energy and shaking intensity (USGS) — why an M4 is thirty-two times the energy of an M3, and why magnitude is not the same thing as how hard it shook where you were.
- IRIS / EarthScope classroom animations — short animated explainers of P and S waves, how a seismometer works, and how three stations locate an earthquake. The best pictures of the ideas on this page.
- Berkeley Seismology Lab — the professionals who watch Northern California, with the faults, the recent events, and the research behind the Hayward–Rodgers Creek system this station sits on.
- The Hayward Fault — is it due for a repeat? (USGS fact sheet) — the local hazard in eight pages, and why the fault under Oakmont is the one to know about.
- USGS Latest Earthquakes — the live map; every catch on this site was confirmed against it.
- Putting Down Roots in Earthquake Country — what to actually do about all of this, from the people who write California’s preparedness guidance.
- ShakeAlert — earthquake early warning for the West Coast. If you live here and your phone is not set up for it, this is the most useful link on the page.