Range
how far this station hears, and how hard that was to pin down
How far can this station hear?
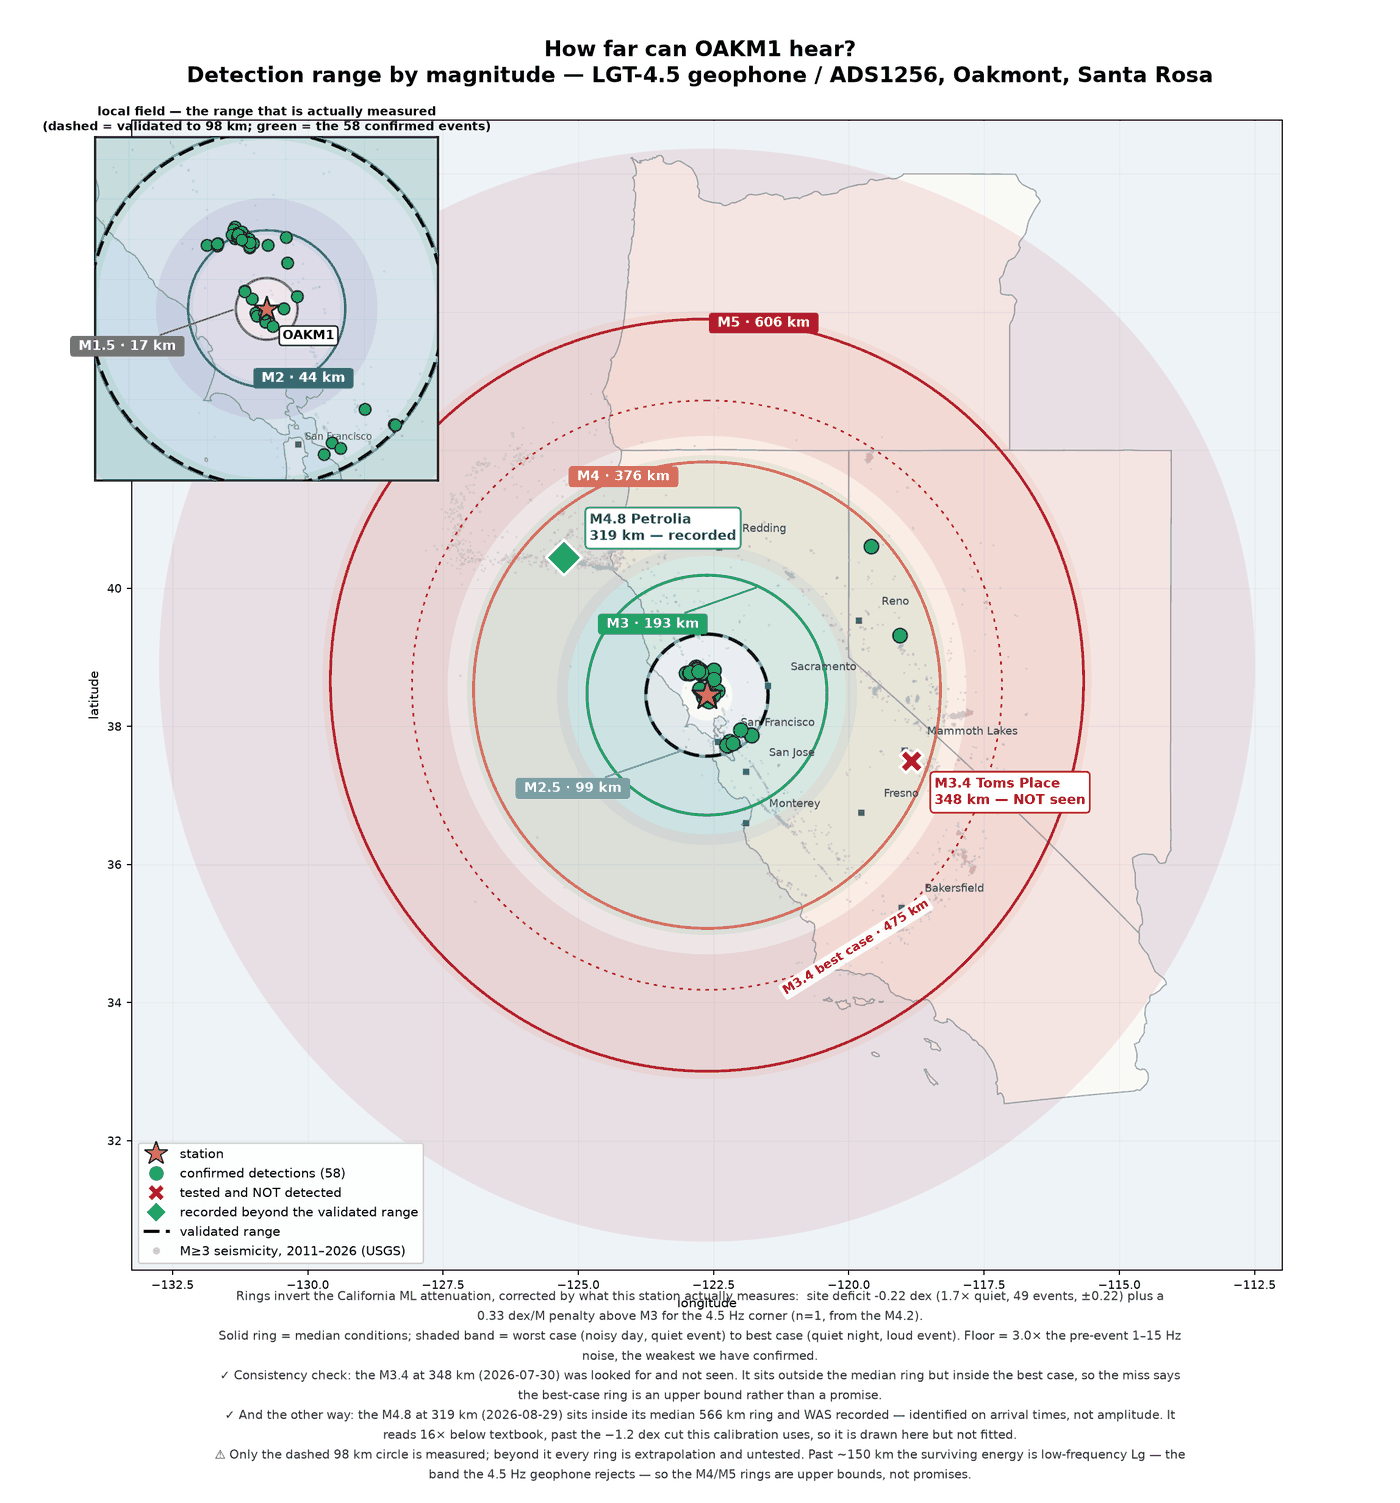
How far can a 4.5 Hz geophone on a garage floor hear? The rings are the predicted reach by magnitude, inverted from the same amplitude model the harvester uses and corrected by what the confirmed catches actually measured. Three rings per magnitude: the inner is a noisy afternoon, the outer a quiet night. Dots are the confirmed catches — 58 of them, out to 98.2 km, and the dashed line is the furthest. Corrected for what those measured, the station reads about 1.8× quieter than the textbook California attenuation predicts.
Two events sit outside that circle and are the only hard constraints on the far field. The X is an M3.4 at 348 km that was looked for and not seen: it falls outside the median ring but inside the best-case one, so the miss says the best case is an upper bound rather than a promise. The diamond is the M4.8 off Petrolia at 319 km that was recorded (below) — identified by arrival time rather than amplitude, and deliberately left out of the fit, because it reads 16× below textbook and letting one far-field point in would reshape every ring on the map.
Everything past the dashed line is extrapolation. Beyond ~150 km what survives is low-frequency Lg energy, exactly where this geophone is deaf, so the outer rings are upper bounds. The map is regenerated whenever the catalog comparison is re-run.
Beyond the map: a P wave from Panama
Everything on the map above is local or regional. On 9 October 2026 an M7.7 struck 12 km WSW of Pitaloza Arriba, Panama, at 17:56:06 UTC, 5,409 km from here. Its P wave is a compressional pulse that dives through the mantle and comes back up. It arrived 8 minutes 44 seconds later, and the station recorded it. This is our first teleseism: an earthquake recorded from the other side of the world.
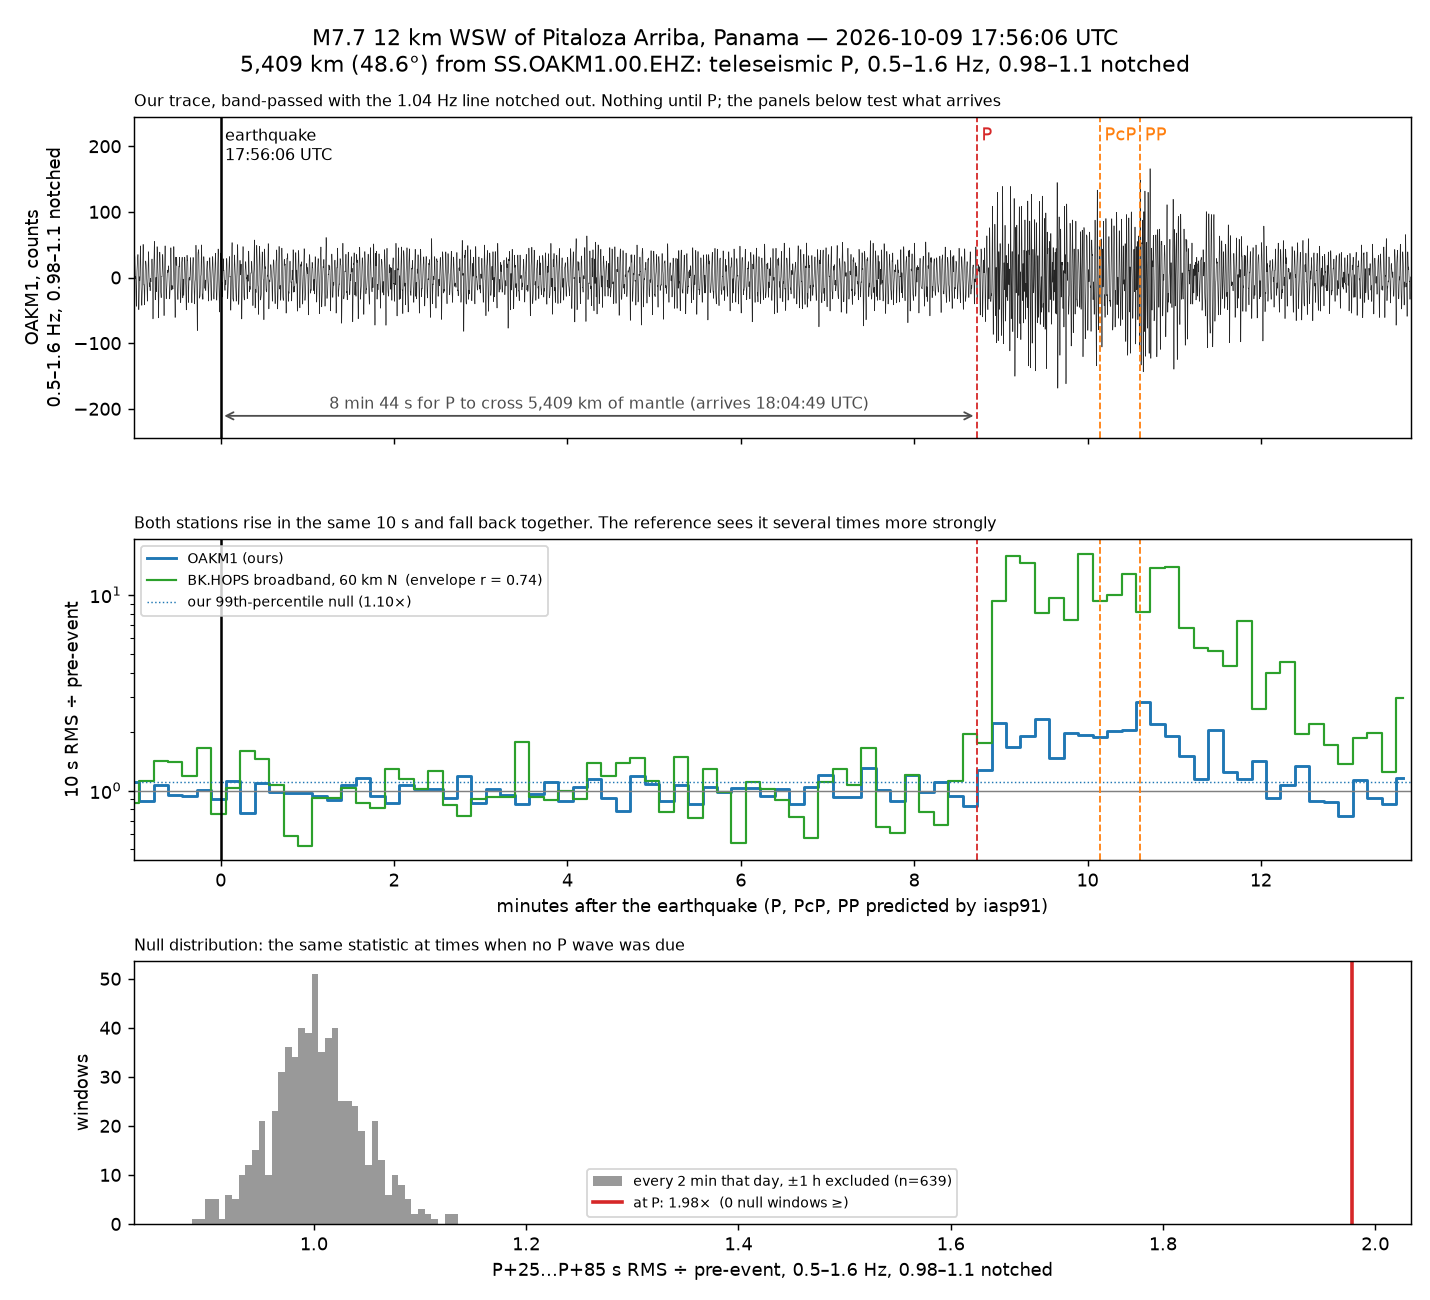
What we saw. Between 0.5 and 1.6 Hz, the ground motion rose to about twice its background within 10 seconds of the predicted P arrival. It stayed up for about two and a half minutes, through PcP (P reflected off the core) and PP (P that bounced once off the surface on the way). To check that this was not ordinary afternoon noise, we ran the same measurement every two minutes for the rest of the day. None of 639 windows passed 1.14×. BK.HOPS, a professional broadband station 60 km north, rises in the same 10 seconds, and the two envelopes track each other (r = 0.74).
What we didn’t. At this distance most of a big quake’s energy travels as surface waves with periods of 20–50 seconds. HOPS recorded them at over 300× its background; we recorded nothing. Below its 4.5 Hz resonance a geophone’s sensitivity falls as the square of frequency, so at 0.03 Hz it is about 22,000× down. That is the price of a cheap, sensitive sensor, and no processing buys it back.
What it taught us. In August, after an M5.5 in El Salvador left no trace, this project wrote that teleseisms were “structurally impossible here, however large.” That was right about surface waves and wrong about “however large.” Recording the P wave also showed that the station’s own ~1.04 Hz electronic hum sits in the middle of this band. Filtering it out roughly doubles how clearly the P wave stands out. One honest caveat: the band and that filter were chosen after looking at this one earthquake. The next big one will test them.
The limit. Two and a half hours later an M6.6 aftershock struck almost the same spot, and this time the station saw nothing. HOPS recorded its P wave at about a third of the strength, which is below what this station can pick out. So at this distance the smallest quake we can hear lies somewhere between M6.6 and M7.7.
Against the reference station
NP.1835 is a USGS National Strong-Motion Project accelerometer at Santa Rosa Fire Station 7, 1.64 km from this geophone, whose waveforms and full instrument response the Northern California Earthquake Data Center serves publicly. Same basin, same geology, same earthquakes: it is as good a reference as this project will ever have, and every absolute number this station reports is anchored to it.
The method is a direct waveform comparison. The reference’s response is removed to ground velocity; our counts are converted with the provisional sensitivity of 9.0 V/(m/s) that this same comparison produced (the nameplate says 28.8, and is wrong by 3.2×); both are band-passed to 5–15 Hz, above the geophone’s 4.5 Hz corner where its response is flat and nothing has to be modelled on our side. If the calibration is right the two traces lie on top of each other and the ratio printed on each figure is 1.0. Each featured catch below carries its own side-by-side figure.
Result so far: over the 46 confirmed events the reference could see clearly, the residual ratio has a median of 1.22× (range 0.63–5.68), so the 3.2× correction in use is right to within the site scatter two stations 1.64 km apart are entitled to. The spread is the interesting part: at 5–15 Hz two sites that close routinely differ by 2× on the same event, and which way depends on the path.
Two honesty flags. A strong-motion accelerometer is deaf where a geophone is comfortable: below its own noise floor the ratio is meaningless and is greyed out in the table — though the figure is still worth a look, because a professional instrument measuring itself while this one records an earthquake at 60× signal-to-noise is rather the point of a sensitivity-first design. And events before the 2026-08-07 front-end rebuild are a different amplitude epoch, marked †: shown, never averaged.