Activity
when the neighbourhood is noisy — local time
Last 7 days · hour by hour
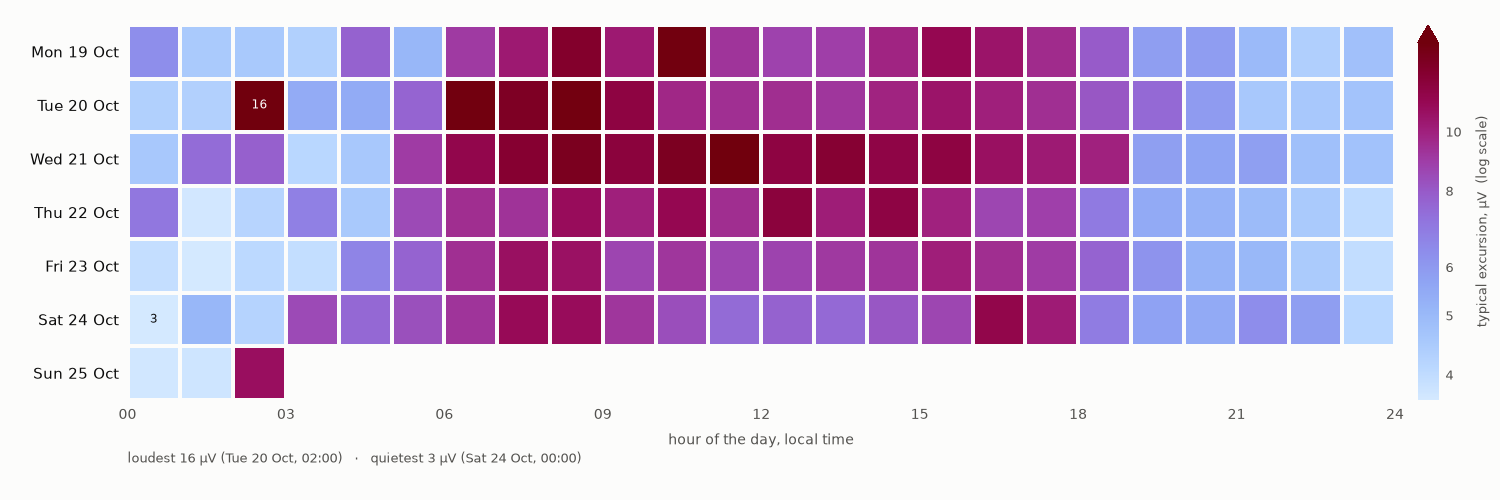
Every cell is one hour, coloured by how much the ground was moving — the median of that hour’s four helicorder intervals. Pale blue is quiet, deep red is busy, and the colour also darkens the whole way, so the picture survives being printed or read by a colourblind eye. Times are local, not UTC, because this chart is about people: indexed by UTC the morning rush would land in the middle of the night.
Almost everything here is human. The quiet band across the small hours is the neighbourhood asleep; it lifts around 05:00, runs loud through the working day, and falls away again after dark. Roughly a 4× swing between 4 AM and mid-afternoon, and none of it is geology. That is also why this station detects smaller earthquakes at night — the same quake has to compete with four times less noise.
A typical week
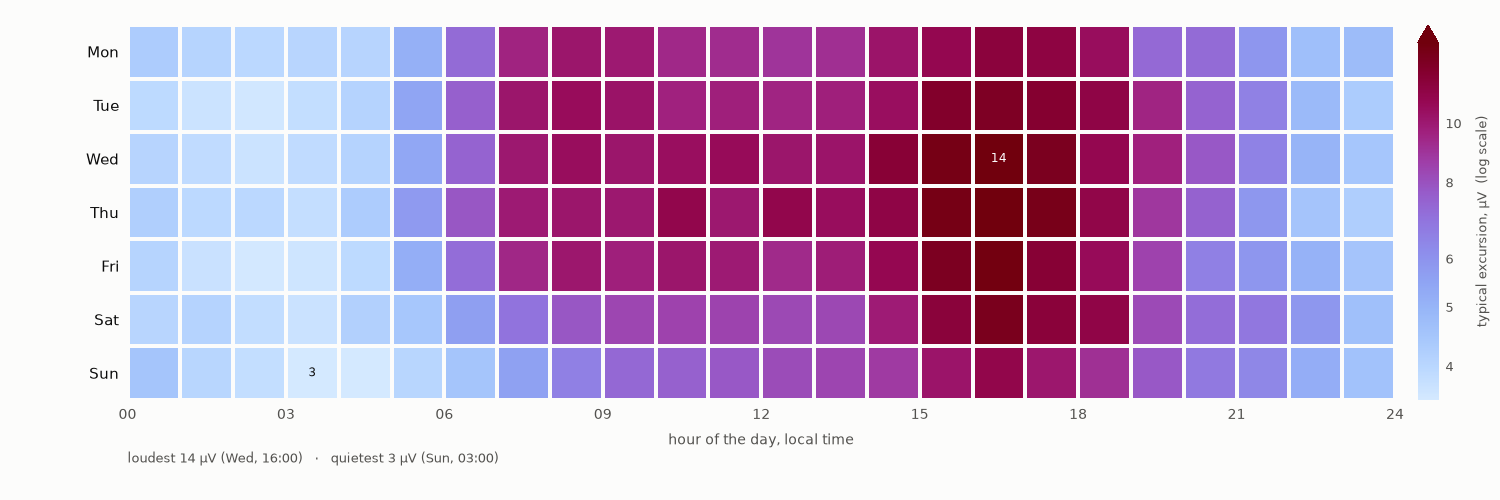
Every hour since the last configuration change, collapsed onto one week.
Last 7 days · against the typical week
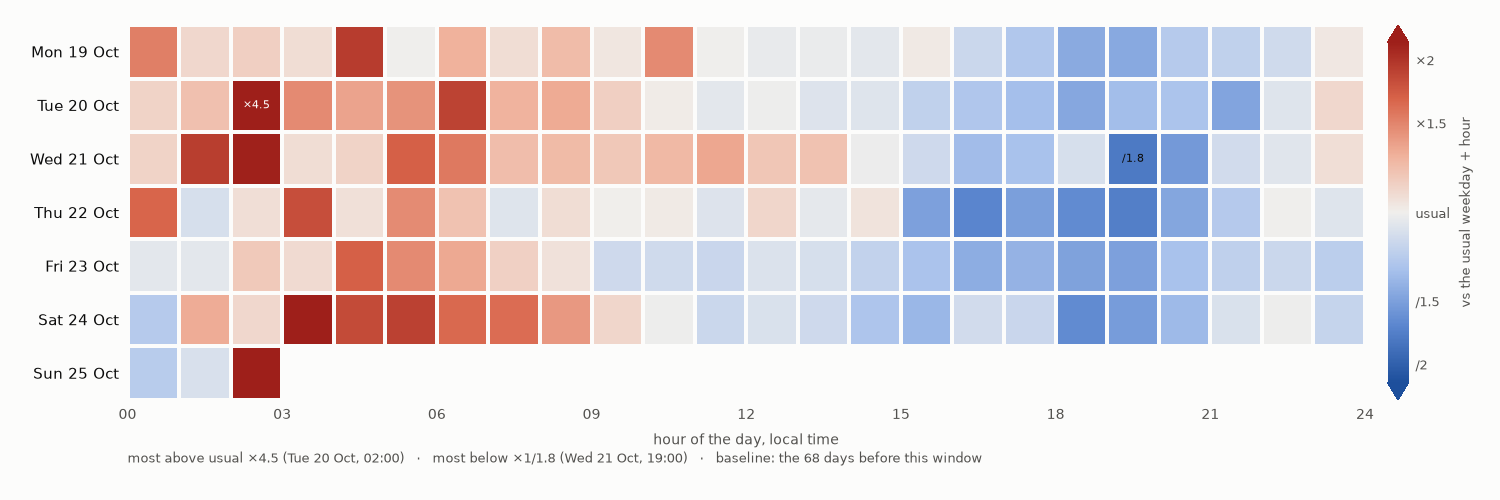
The top chart again, but each hour divided by what that weekday and hour usually looks like. Grey is an ordinary hour; red was louder than usual, blue quieter. The “usual” comes from the weeks before these seven days, so a busy week is not quietly averaged into its own yardstick. A red block is a busy morning on Route 12, a contractor’s machinery, the laundry — or, once in a while, something worth looking at on the drum.