M3.3 · 3 km ESE of Larkfield-Wikiup, CA
one catch · SS.OAKM1.00.EHZ
M3.3 · 3 km ESE of Larkfield-Wikiup, CA
2026-09-03 17:33:27 UTC · 13.3 km (NW) · depth 8.8 km
- magnitude
- 3.3
- distance
- 13.3 km
- depth
- 8.8 km
- envelope peak
- 2,668 µV
- envelope SNR
- 462×
- P predicted
- 2.6 s
- sustain
- 3.5 s
- low/high band
- 5.9×
- vs NP.1835
- 1.31×
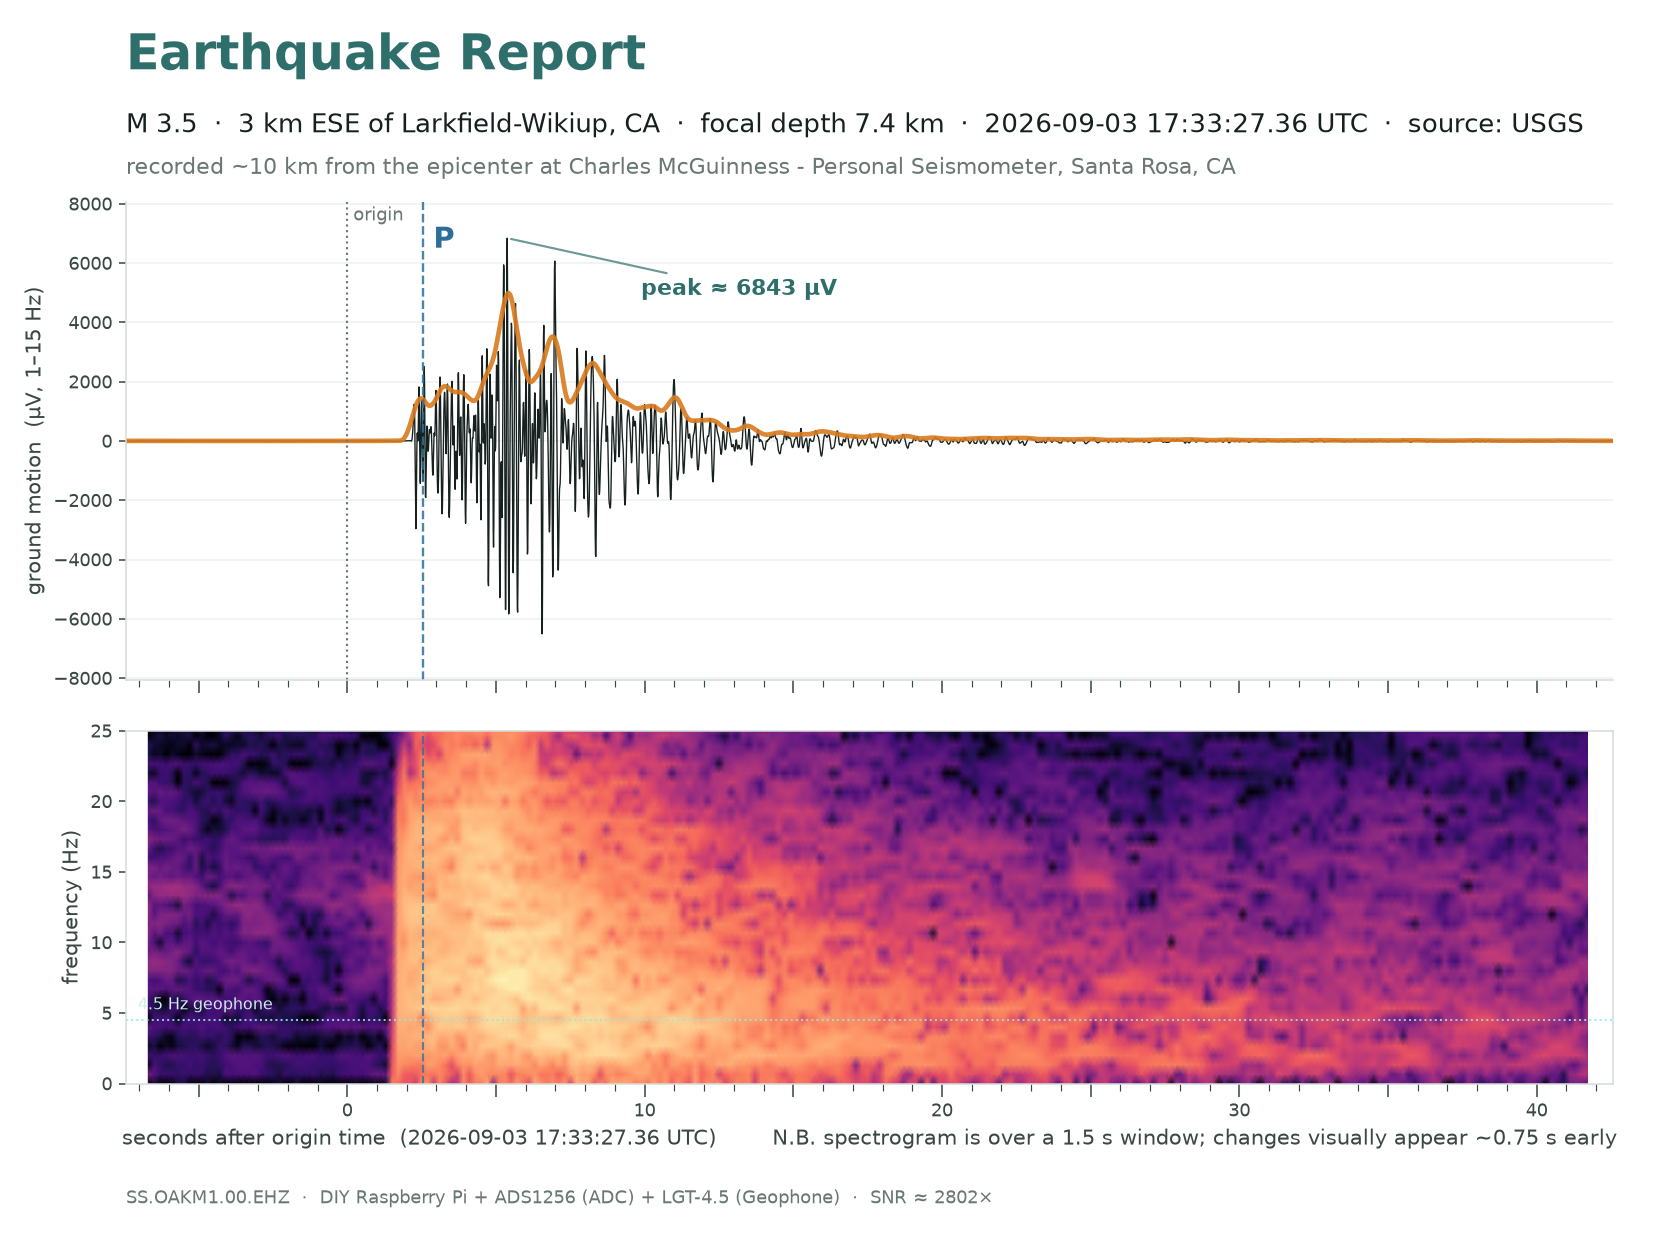
Listen for how the pitch balance changes at the P wave (marked where it was picked), at the S wave (the dashed mark is its predicted arrival) and through the coda that follows. Volume is normalised to this clip, so it only says how much energy there is before, during and after the event relative to its own peak — not how big the earthquake was.
- Five times anything before it. The peak in the 1–15 Hz band was 6,843 µV against the M4.2 Cloverdale’s 1,406, and the ADC still had sevenfold headroom: at gain 64 it clips near 39,000 µV. In ground terms, NP.1835 read a peak of 1.5 mm/s in the 5–15 Hz band, this station 0.84 mm/s.
- The closest sizeable earthquake in the record, 13.3 km hypocentral at bearing 304°, under the Rodgers Creek fault — the fault system this station was sited to listen to. Nothing else at M2.5 or above has landed within 35 km, so at this magnitude it is nearest by a factor of three; four smaller catches are closer still. P broke out of the noise at +2.2 s after origin against a predicted +2.6; S was due at about +4.4. With so little path there is almost no room for the two to separate.
- Felt. Plainly, in the house, before any instrument said so. The USGS “Did You Feel It?” intensity opened at MMI II and ShakeMap puts MMI 3.4 at the epicentre. The first catch on this page that was an event to the people living above the sensor rather than only to the sensor.
- The classifier was never in doubt. p(quake) 0.998; the high/low band ratio was 0.32 where the fourteen other triggers in the surrounding quarter hour ran 1.2 to 5.5 and scored at most 0.008.
- Against NP.1835, 1.64 km away: RMS ratio 1.31×, peak 1.82× in the 5–15 Hz band, and the two envelopes lie on top of each other from the peak through the whole coda. Before the P wave the accelerometer’s own floor is visible at 1.7 µm/s; ours sits at 0.3.
- Reviewed by USGS, and then revised. The same-day review left the hypocentre where it was; the weekly re-harvest on 2026-09-04 picked up a later revision that moved it — M3.54→3.34, 12.4→13.3 km, depth 7.4→8.8 km. Every number on this page is the revised one. That is exactly why
analysis/reharvest.pyexists: an automatic solution appears in minutes, a reviewed one can take days, and a page built on the first is quietly wrong. Forty-two stations within 40 km picked the P wave (analysis/network_residuals.py): 1835 sits in the middle of the near-field crowd and this station is the early one, by about 0.1 s relative to its neighbours — the slab at the foot of the hills, not the clock, which is GPS-disciplined to microseconds.
Hear the real thing
You need a subwoofer or good over-ear headphones. This is 20–50 Hz — the bottom octave and a half of human hearing. Laptop and phone speakers roll off near 150 Hz and will play nothing at all. That is the speaker, not the recording.
Not a sonification. Every other clip on this site is pitch-shifted, because ground motion at 1–10 Hz is below hearing and plays as silence at true speed. This earthquake was close enough and shallow enough to still carry real energy at 20–50 Hz, and people around Santa Rosa heard it as a sound. So this plays at 1:1 — same duration, same pitch, nothing shifted. It is the bottom of what was actually heard: the archive stops at 50 Hz, so every overtone above that is missing, and the ADC’s own roll-off has been divided back out (analysis/audible.py).
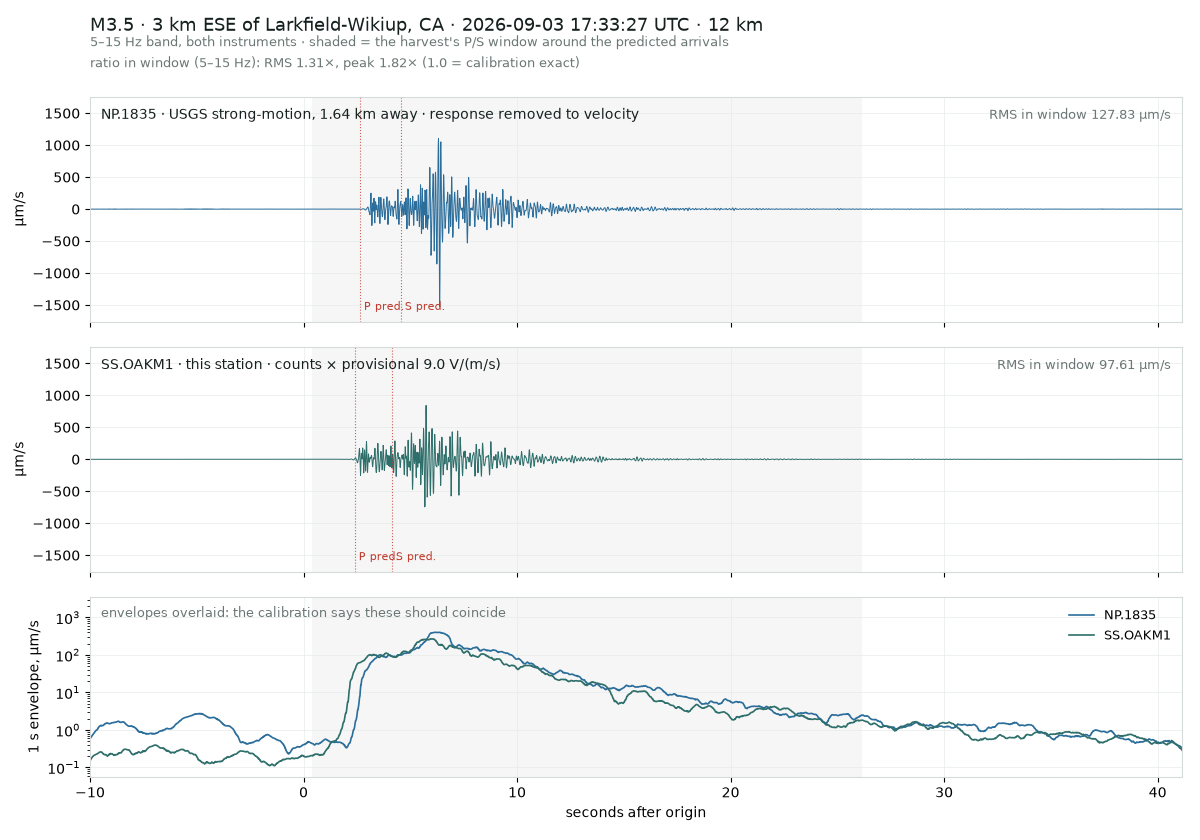
Side by side with USGS NP.1835, 1.64 km away, both in ground velocity.