M3.8 · 3 km N of San Leandro, CA
one catch · SS.OAKM1.00.EHZ
M3.8 · 3 km N of San Leandro, CA
2026-08-13 15:30:04 UTC · 88.0 km (SSE) · depth 5.5 km
- magnitude
- 3.8
- distance
- 88.0 km
- depth
- 5.5 km
- envelope peak
- 175 µV
- envelope SNR
- 35×
- P predicted
- 15.2 s
- sustain
- 7.1 s
- low/high band
- 46.4×
- vs NP.1835
- 1.39×
P
S
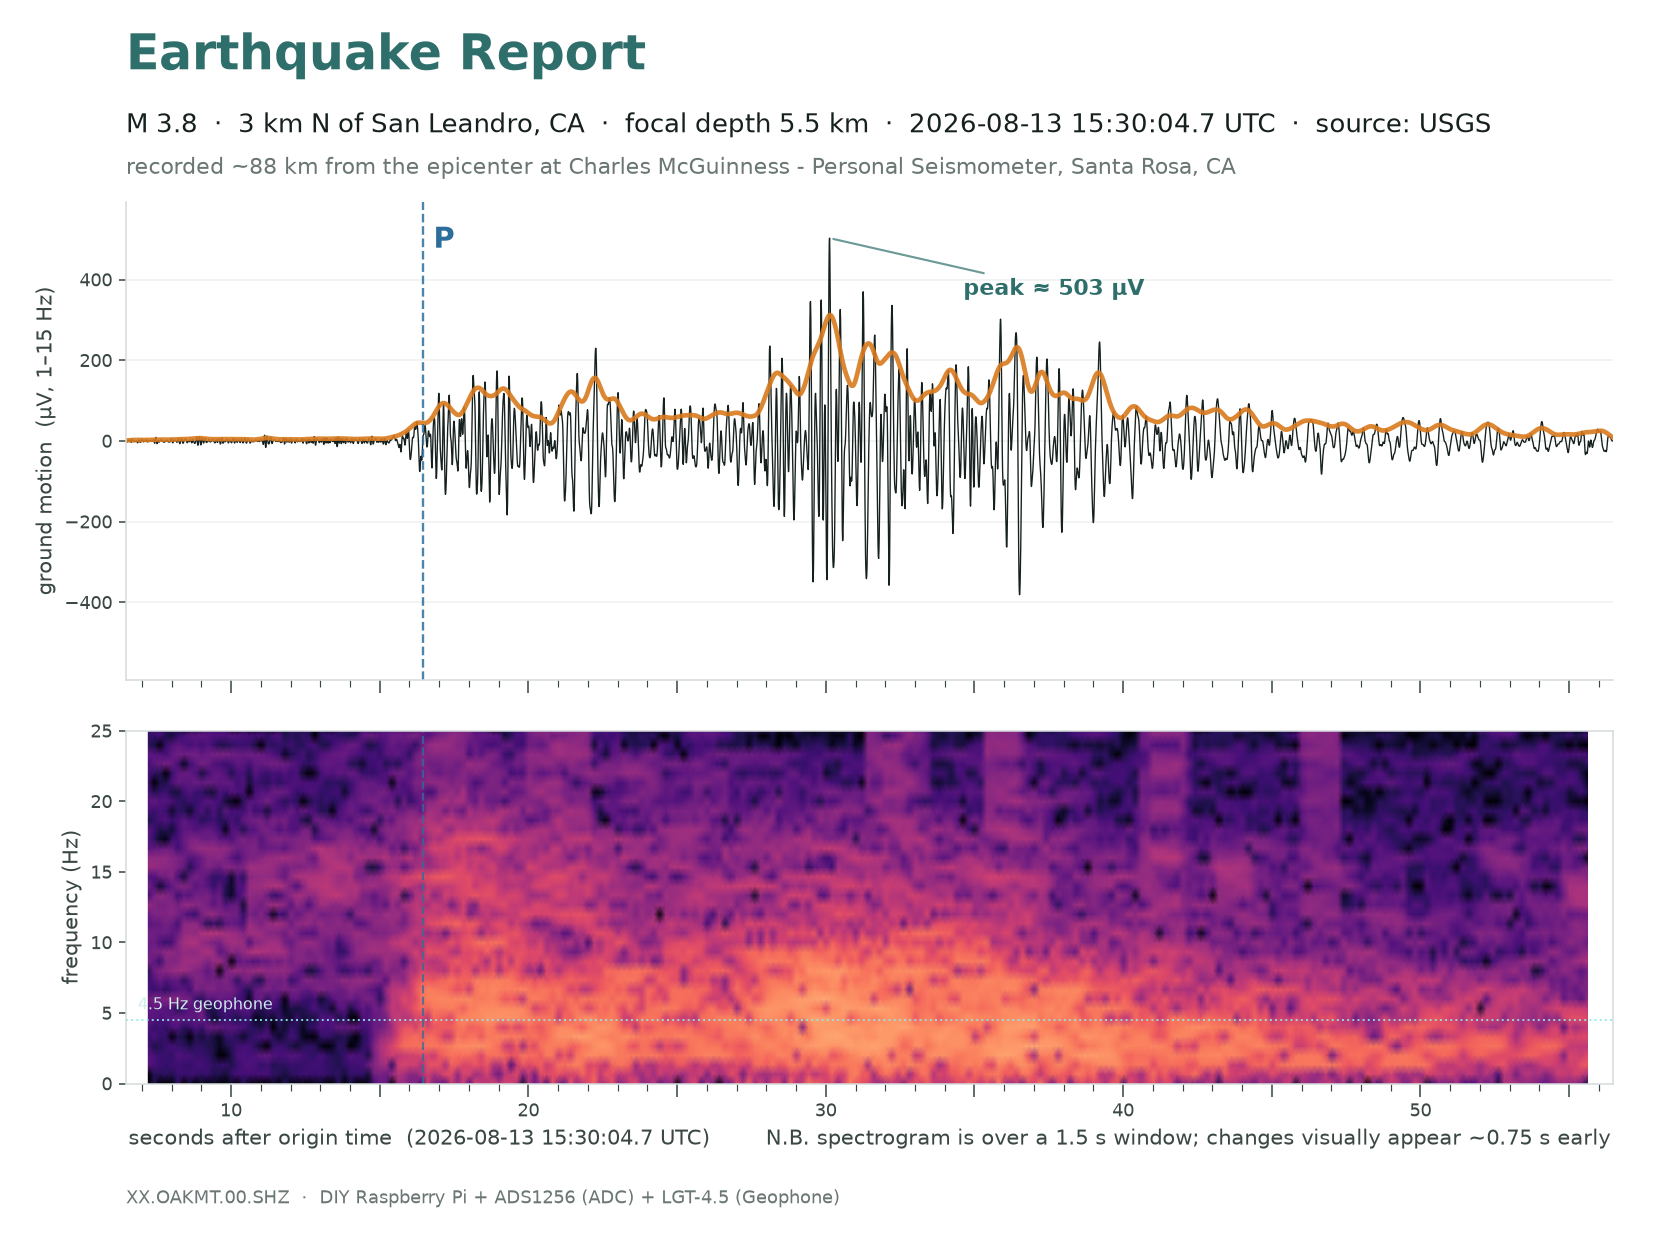
Listen for how the pitch balance changes at the P wave (marked where it was picked), at the S wave (the dashed mark is its predicted arrival) and through the coda that follows. Volume is normalised to this clip, so it only says how much energy there is before, during and after the event relative to its own peak — not how big the earthquake was.
- Still the furthest catch inside the calibrated range — 88 km, nearly twice the previous record, and the event the map’s dashed circle is drawn from. The M4.8 off Petrolia was recorded nearly four times further out, but it reads so far below the textbook amplitude that it is deliberately left out of the fit, so this is where measurement still ends and inference begins. Peak 503 µV at +30 s, the energy arriving as a long train of S and surface waves rather than a sharp onset — what 88 km of crust does to a signal.
- The Hayward and Rodgers Creek faults are one connected system; this is the neighbour to the south announcing itself.
- A second event of M2.8 followed 37 minutes later and was recorded too. Both were used to calibrate this station against a USGS strong-motion instrument 1.6 km away.
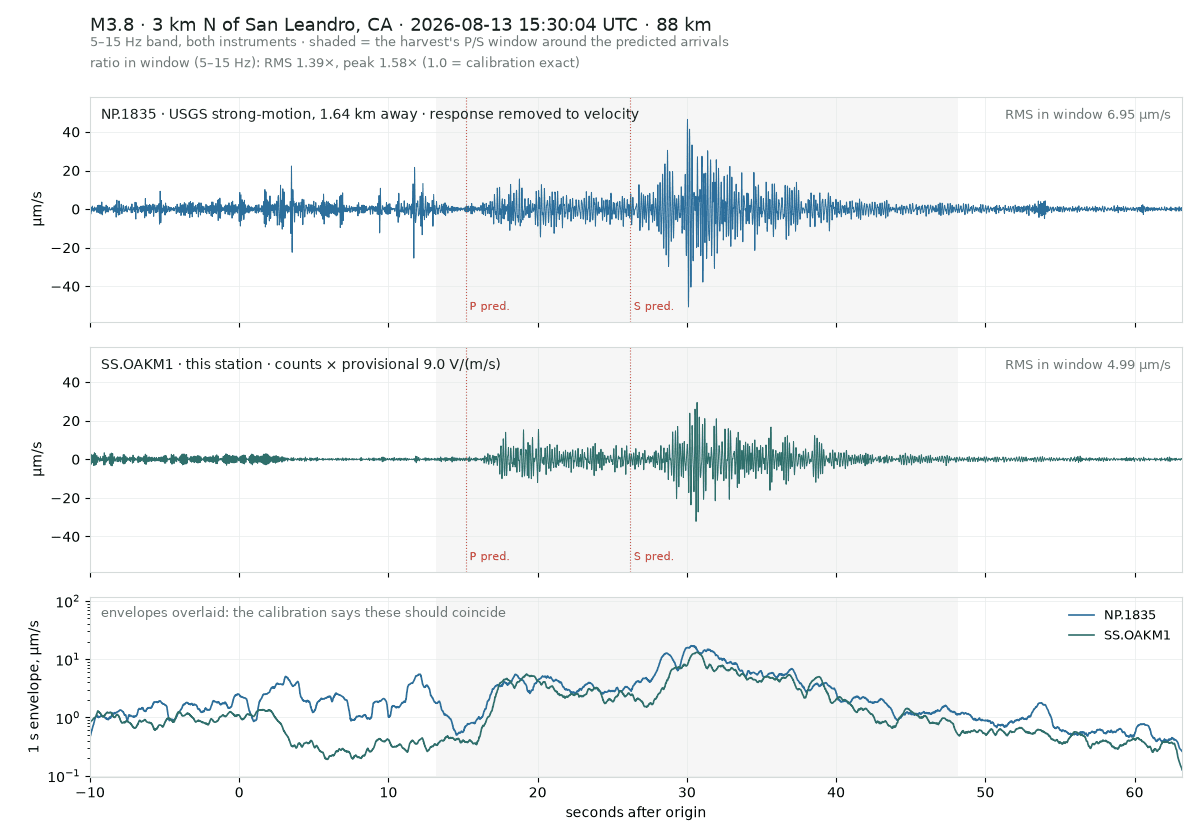
Side by side with USGS NP.1835, 1.64 km away, both in ground velocity.
Independent station. Times are UTC. Built by Charles McGuinness.