M2.4 · 2 km N of Middletown, CA
one catch · SS.OAKM1.00.EHZ
M2.4 · 2 km N of Middletown, CA
2026-09-02 03:49:01 UTC · 35.8 km (N) · depth 4.7 km
- magnitude
- 2.4
- distance
- 35.8 km
- depth
- 4.7 km
- envelope peak
- 32 µV
- envelope SNR
- 16×
- P predicted
- 6.2 s
- sustain
- 7.2 s
- low/high band
- 21.0×
- vs NP.1835
- 1.37×
P
S
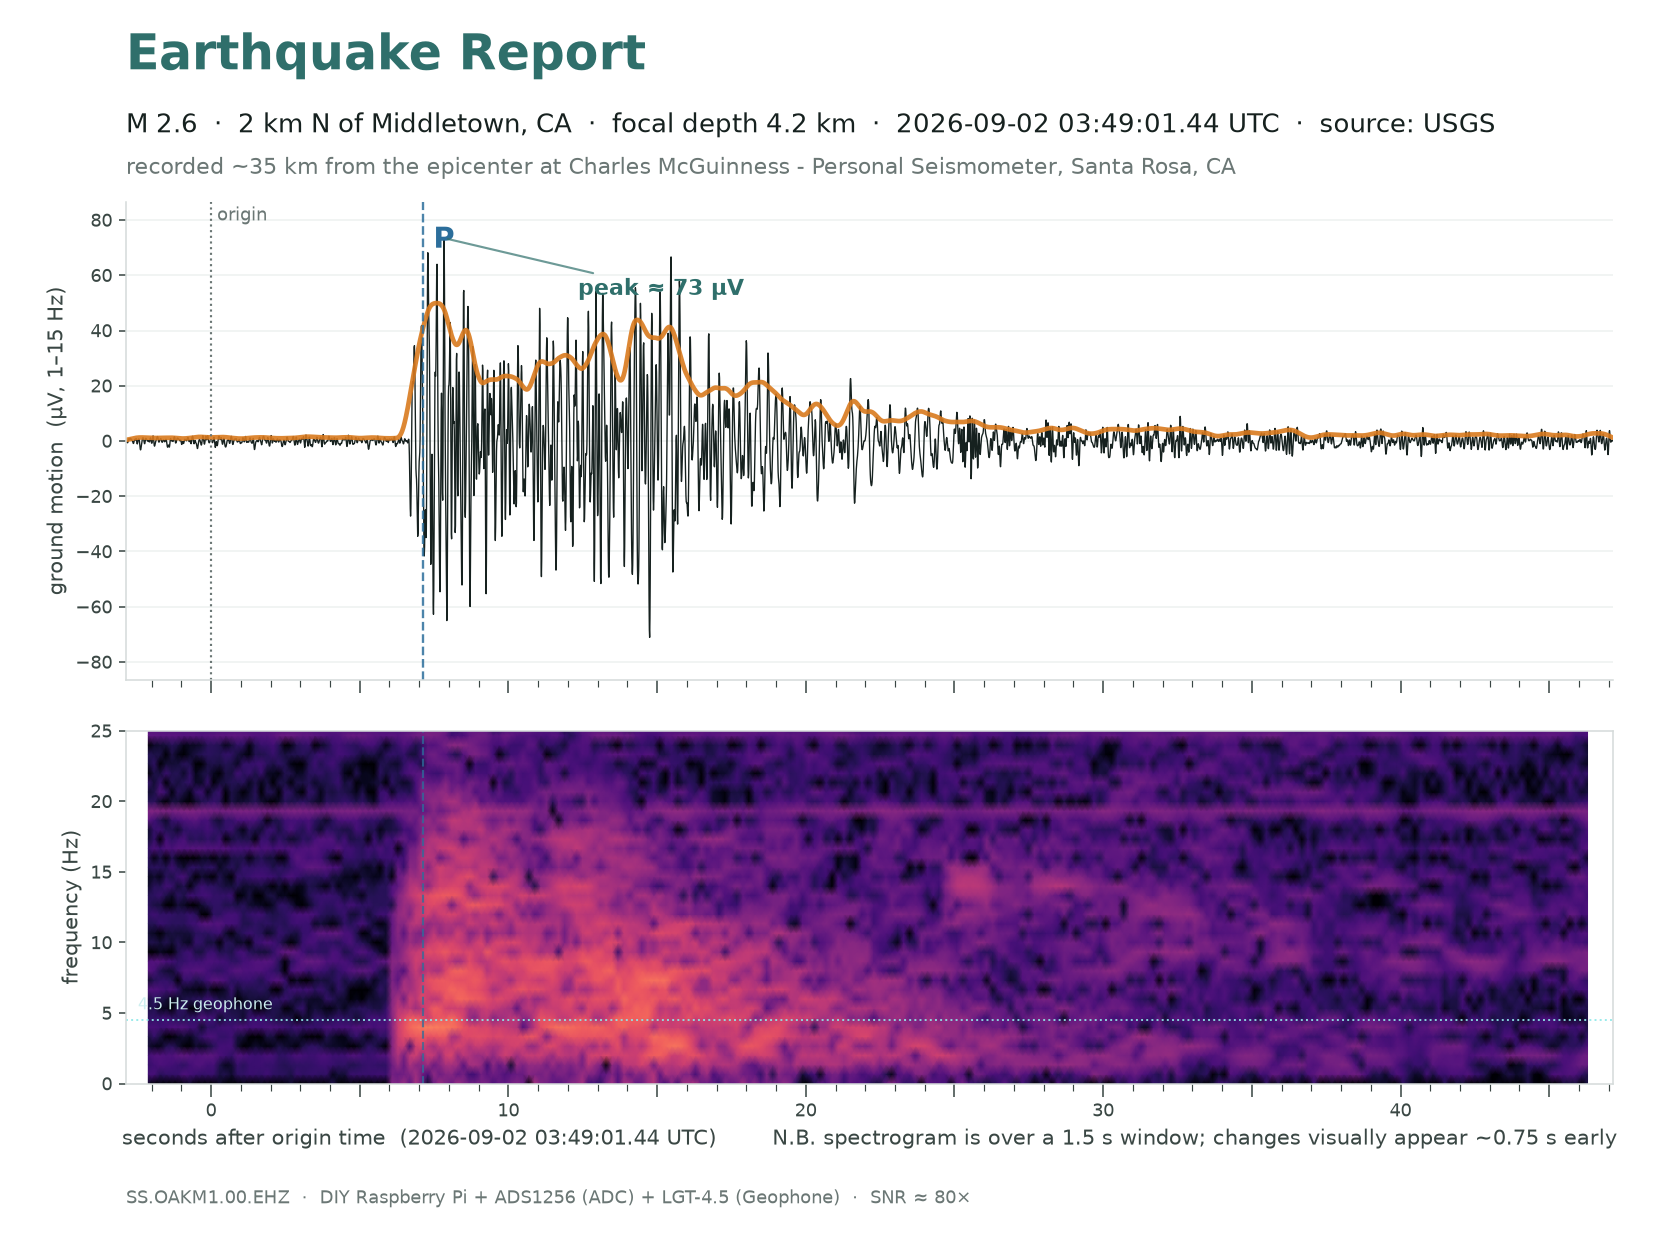
Listen for how the pitch balance changes at the P wave (marked where it was picked), at the S wave (the dashed mark is its predicted arrival) and through the coda that follows. Volume is normalised to this clip, so it only says how much energy there is before, during and after the event relative to its own peak — not how big the earthquake was.
- People felt this one. The USGS “Did You Feel It?” intensity came back as MMI II — the bottom of the felt scale, the kind you notice only if you are sitting still indoors. That is the interesting part: at M2.6 and 35 km this sits right at the threshold where an earthquake stops being purely an instrumental event, and it is a usable data point for the question of whether an alert should say “probably felt” rather than quoting a detector ratio at you.
- Not The Geysers, which is where most of our catalogue comes from. The geothermal field lies 15.6 km WNW of this epicentre, at bearing 339° from the station; this arrived at bearing 1.3°, almost due north. Of the ~990 catalogued events between 30 and 50 km, 849 are Geysers or Cobb induced seismicity inside a narrow 335–350° band. This is a different patch of crust — the Collayomi fault zone, tectonic rather than steam-field — and it is the first one we have caught from it: four earlier Middletown events, M0.46 to M1.52, all went past unrecorded.
- The station’s own velocity model beat the global one. P broke out of the noise at +7.14 s. Our locally measured 5.19 km/s relation predicted +7.18 s — wrong by 0.04 s. iasp91, the global average used past 15 km, said +6.10 s, a full second early. At local distances the crust under Sonoma County is genuinely slower than the world average, which is exactly why that measurement was worth making.
- The classifier had a good night. The detector fired 17 times in the 11 minutes around this event. Its neighbours scored p(quake) between 0.002 and 0.016; this one scored 0.999 and pushed an alert. Its high/low band ratio was 0.31 where the surrounding triggers ran 1.7 to 6.9.
- What 35 km does to a signal — compare it with Petrolia. The spectrogram here carries energy right up past 20 Hz, because there is barely enough crust in the way to filter anything out. The M4.8 at 319 km is a far bigger earthquake and arrives with nothing above ~7 Hz. Same instrument, same summer; the difference is entirely the path.
- Peak 73 µV in 1–15 Hz, SNR ~46×, detector ratio 116.
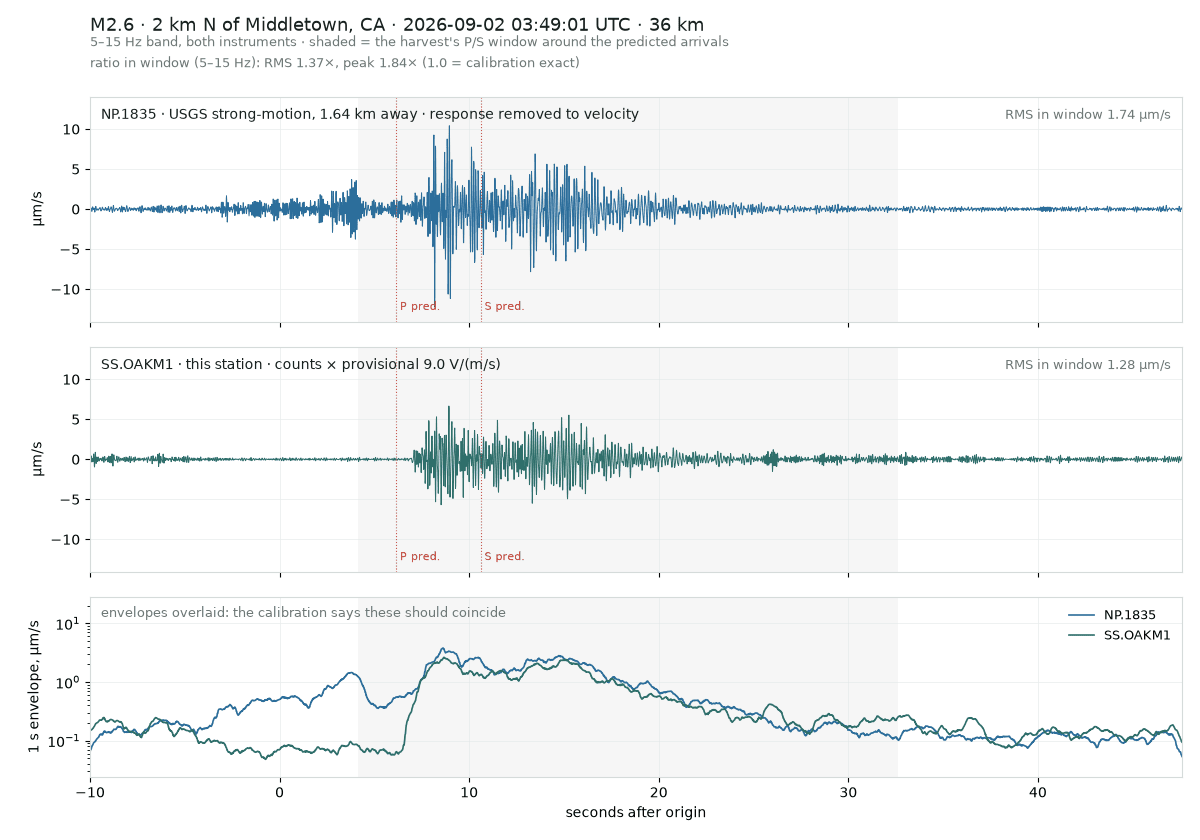
Side by side with USGS NP.1835, 1.64 km away, both in ground velocity.
Independent station. Times are UTC. Built by Charles McGuinness.